Z-Based Structural Index Correlation Method
Technical Description
Crude Oil is made up of Homologous Series of Compounds
It has been known for more than 100 years that components of petroleum fall into a few dozen homologous series defined by the empirical formula CnH2n+z. (1-3) In subsequent research heteroatoms, N, S, and O, were added to these series. Consequently, all components of petroleum can be classified by the generalized empirical formula:
CnH2n+zNuSvOw…
Where ‘z’, ‘u’, ‘v’, ‘w’, … are integer values that classify an individual molecule by a z-vector.
The ‘n’ value is the primary variable that defines a homologous series. As ‘n’ ® ¥ , all properties, Pi, approach the value for the corresponding property of an infinitely long paraffin. The use of this empirical formula as a classification system and the definition of ‘n’ as the primary structural index variable for property correlations is the foundation of the Z-BaSICTM method.
How Z-BaSICTM Correlates Properties with Members of Homologous Series
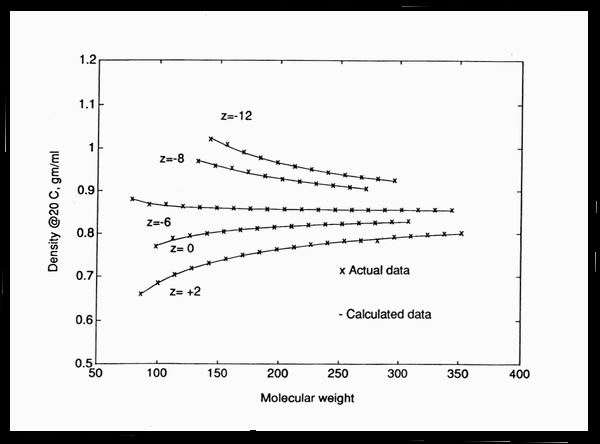
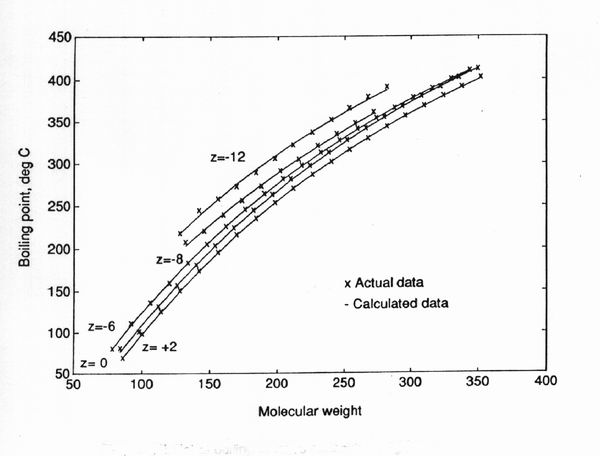
The fact that variations in the values for ‘n’ rigorously correspond to variations in molecular weight by 1 carbon and 2 hydrogen atoms, makes the relationship between ‘n’ and Pi highly correlatable over wide ranges of ‘n’ including extrapolation to the heavy ends of petroleum. The correlations are illustrated in Figures 1 and 2 for two common properties, boiling point and density. In general, all properties and specifications exhibit the behavior of a sloping asymptote, illustrated by boiling point or a horizontal asymptote, illustrated by density. This allows for confident extrapolation when using correlating equations (linear/linear or quadratic/linear equations) that behave as expected in the extreme ‘n’.
There is no effective limit to the number of pure compound properties that can be correlated by this approach. Properties may include physical and thermodynamic properties, coefficients of equations-of-state (vapor pressure, viscosity, etc.), reaction properties and product specifications. A more complete description of the method is contained in references (4) and (5).
How Z-BaSICTM Measures the Components
A GC-MSD is used for primary analysis. The nominal parent mass of each member is known from the empirical formula. Different empirical formulas that yield the same nominal mass are distinguished by observing the retention time behavior in the chromatogram.
To illustrate, and using the GC-MSD method described in Appendix A consider the retention time of n-nonane (z-vector = +2,0,0,0; 128 amu) at 13.36 min and naphthalene (z-vector = -12,0,0,0; 128amu) at 21.77 min. Or, consider C4 alkyl benzenes (z-vector = -6,0,0,0; 134 amu) at 16.7-21.0 min and benzothiophene (z-vector = -10, 0, 1, 0; 134 amu) at 22.0 min. These z-vectors are readily distinguished by their different retention times even though each comparison is for the same nominal mass. In general, for any given molecular mass the retention time will increase with increasing number of rings, increasing aromaticity, or increasing polarity, allowing for the necessary distinction.
In Z-BaSICTM, retention time behavior is converted to pseudoparaffin number, P*, which is the equivalent fractional normal paraffin that would have eluted at the same time. P* serves as a convenient internal calibration for variations that occur from day to day or from lab to lab, allowing us to correct files obtained at a remote location to our reference files. However, it is necessary that the remotely gathered information be obtained by the specified GC method (see Appendix A).
The identification (pseudoparaffin space and characteristic mass) of approximately 40 z-vector series covering all known non-olefinic compounds found in the <C35 portion of crude oil have been cataloged by this method. Properties of vapor pressure (Antoine equation coefficients), critical temperature and density have been correlated for these series by the correlation methods described above.
The 'cp' file, a computer file for detailing the molecular composition of crude oil.
The components identified by GC-MSD, along with information about the elemental composition, density and boiling point distribution are used to construct a composition/property file, or 'cp' file. An excerpt from such a file is shown in Table-1.
The 'cp' file excerpt consists of the 'n' and 'z' numbers, the Antoine equation coefficients, the density and weight fraction for each component found. Each row is an individual component or, in our current formulations, a consolidation of all isomers of the same 'n' and z-vector. It is possible to expand the number of columns in the 'cp' file to include other pure compound properties, or alternatively develop secondary library files of properties that can be called as needed.
Table-1 C16 – C17 excerpt from a 'cp' file
|
'n' |
'z' |
Pv coefficients |
density |
Weight fraction |
||
|
16.00 |
2.0 |
17.07 |
4926 |
-88.0 |
.773 |
.00334 |
|
13.14 |
-6.0 |
16.70 |
4328 |
-116.9 |
.957 |
.00018 |
|
15.00 |
-10.0 |
16.12 |
4385 |
-105.5 |
.927 |
.00526 |
|
14.00 |
-14.0 |
15.64 |
4132 |
-113.0 |
.962 |
.00117 |
|
14.00 |
-12.0 |
15.84 |
4223 |
-115.9 |
.938 |
.00461 |
|
16.00 |
-6.0 |
15.91 |
4159 |
-121.5 |
.840 |
.00250 |
|
14.29 |
-10.0 |
15.42 |
4162 |
-93.5 |
1.051 |
.00358 |
|
18.00 |
2.0 |
16.11 |
4241 |
-120.5 |
.775 |
.00120 |
|
15.29 |
-10.0 |
15.56 |
4354 |
-95.4 |
1.035 |
.00048 |
|
16.00 |
-8.0 |
15.84 |
4167 |
-124.0 |
.900 |
.00094 |
|
17.00 |
2.0 |
16.15 |
4300 |
-123.4 |
.777 |
.00319 |
The non-integer 'n' is the code for delineating heteroatoms. By multiplying the 'n' value by 14, in combination with the 'z' value, the exact molecular weight of the component is calculated. For all 'cp' files the sum of the weight fraction column is equal to 1.0. The 'cp' file accurately represents the elemental composition, boiling point distribution, and density distribution of the process stream.
The 'cp' file is the standard file for all
Z-BaSICTM applications. It embodies all of the information needed to ‘process’ the stream or report its properties. Even though there may be thousands of components in a 'cp' file there are only two variables, 'n' and 'z'. The fact that all process streams can be described by only two variables greatly facilitates programming and applications development. For example, average 'n' and 'z' can be adjusted with as little as two independent data values. Distributions can be adjusted with a third data value. This characteristic allows for ready interfacing of 'cp' files with commonly monitored properties.The purpose of nearly all refinery operations can be expressed in terms of two chemical changes, molecular weight and hydrogen content. From the ‘cp’ file paraffins, naphthenes and aromatics contents are known as a function of molecular weight. Comparing feedstock and product ‘cp’ files allows for precise determination of the effect of variables on process chemistry. These two changes are directly embodied in the 'n' and 'z' properties of the files. Viewed in this light, it is easy to see how accurate process simulation can be performed on a 'cp' file.
Similarly, troubleshooting tools are readily constructed for specific units. Software to calculate API gravity, properties and product specifications is readily constructed through correlations with ‘n’ for each z-vector. For non-ideal properties arising from interactions of components in mixtures programs may be written to account for the ‘activities’. All process programs are written to prepare ‘cp’ files on the products directly useable to downstream programs or for reporting of properties and specifications.
Crude Oil Distillation Simulation
The portal software is the Crude Oil Distillation Simulation (CODS 1.4.1) program. This program inputs a 'cp' file and simulates an ASTM D-2892 (TBP) distillation. The program calculates the bubble point composition, the dew composition and, using the Fenske equation, converges a calculation to agree with the specified number of stages for the pressure specified. An incremental ‘drop’ is taken and the process is repeated until the cutpoint temperature is reached. A 'cp' file of the composite distillate is stored for reporting of fraction properties and for future use. This process is repeated until the distillation is complete. On a typical PC a simulation extending to the vacuum residue requires a few seconds to complete.
CODS has other features that enhance its usefulness. The composition of whole crudes or fractions distilled by the TBP method can be displayed and imported to Excel format. Assay properties can be reported. Crude oils and fractions can be blended to create a 'cp' file of the blend. ASTM D-86, D-2887, D-1160 and D-5307 distillations can likewise be performed on whole crudes or fractions. For each operation 'cp' files of the products are generated and are available for subsequent processing or reporting. A brief description of the operation of CODS 1.4.1 is given in Appendix B.
Interface with currently-installed software
The intelligence and precision afforded by
Z-BaSICTM can be used to enhance existing systems without disruption. Programs can readily be customized to prepare files in the form of input files to conventional evaluation, simulation and control software. We refer to these files as *.ini files to represent that any input file can be accommodated by Z-BaSICTM.Applications
Consider the 'cp' file as a computer surrogate of the actual process stream. Executable programs have been written to report composition and properties, assess the relationship between properties and composition, simulate processes, monitor changes in stream composition for use in control and optimization, or perform component balances on a unit operation, entire plant or entire system. The form of ‘cp’ files is a digital ‘standard’ for all
Z-BaSICTM applications. Thus, crude oil evaluation, process monitor and control, and refinery-wide simulation and optimization can be performed using a common file standard.
The following applications have been developed or are under development:
Evaluation software - For assisting with procurement and scheduling decisions. For pipeline and tank quality control, for on-line blend control.
Simple crude assays - Boiling point yields, sulfur, density.
Extended crude assays - Composition and properties of pseudocomponents
Specification assays
Crude -
Output customized to your LP program input.Products - Obtain specifications directly through correlations with composition.
Stream Monitor - Use easily monitored properties, d, v, ri, to estimate other properties.
Composition reports - Reports the stream composition, molecular or pseudcomponent output, in real time.
Property reports - Reports physical and API properties on any stream.
Process Software – For modeling, simulating, controlling and optimizing processes.
Distillation simulation/Flash Simulator - Simulates V/L process at the fundamental level.
Blend - Mix streams to obtain desired properties and yields
Separation Process Modeling
Liquid-Liquid Extraction - Uses activities to calculate partition functions (under development)
Liquid-Solid Adsorption - Uses activities to calculate adsorption free energies (under development)
Crystallization and Precipitation - Relies on the BRD model U.S. patent 5,574,215 (under development)
Asphaltene formation - Extension of Precipitation simulation (under development).
Conversion Process Simulation
- All conversion process simulators are written for in terms of 'n' and 'z' values. 'n' relates to molecular weight changes and 'z' relates to aromaticity and heteroatom conversions. The following are planned for development.Reforming
Hydrodesulfurization
Isomerization
Distillate Hydrodewaxing
Fluid Catalytic Cracking
Catalytic Hydrocracking
Coking
System Integration Software – To integrate Z-BaSICTM with business decision software.
Summary
In summary, Z-BaSICTM is the first methodology that allows the petroleum industry to evaluate and control processes and product specifications at the molecular level, promising to dramatically reduce the errors inherent in more empirical, pseudocomponent descriptions, and allowing for greater automation with greater assurances of optimum results. This is expected to result in reduced costs and greater profits.
References
Contact- Dr. J. W. Bunger at (801) 975-1456 or
zbasic@jwba.com
Figure 1 Boiling Point Correlation
Figure 2 Density Correlation